Monitoring : Part 4
In the previous post, Monitoring : Part 3 we created some basic Prometheus metrics using Erlang. In this post we’ll explore those metrics in Grafana to get a feel for how Grafana works.
Launch Metrics
mkdir temp
cd temp
git clone https://github.com/toddg/emitter
Start the docker components.
cd emitter
make start
Wait a second and run docker ps to verify the containers started and stayed started:
$ docker ps

CONTAINER ID        IMAGE                     COMMAND                  CREATED             STATUS              PORTS                    NAMES
506443c4d497        toddg/erlang-wavegen      "/bin/bash -l -c /bu…"   12 seconds ago      Up 8 seconds        0.0.0.0:4444->4444/tcp   monitor_wavegen_1
b6b7cc6e0128        grafana/grafana:6.2.4     "/run.sh"                12 seconds ago      Up 7 seconds        0.0.0.0:3000->3000/tcp   monitor_grafana_1
f8cef82f727e        prom/prometheus:v2.10.0   "/bin/prometheus --c…"   12 seconds ago      Up 6 seconds        0.0.0.0:9090->9090/tcp   monitor_prometheus_1
Interesting URLs
wavegen
 curl http://localhost:4444/metrics | grep my | head
  % Total    % Received % Xferd  Average Speed   Time    Time     Time  Current
                                 Dload  Upload   Total   Spent    Left  Speed
100 94392  100 94392    0     0   970k      0 --:--:-- --:--:-- --:--:--  970k
# TYPE mycounter counter
# HELP mycounter count the times each method has been invoked
mycounter{method="flatline"} 11295
mycounter{method="flipflop"} 11295
mycounter{method="incrementer"} 11295
mycounter{method="sinewave"} 11295
# TYPE myguage gauge
# HELP myguage current value of a method
myguage{method="flipflop"} 1
myguage{method="incrementer"} 11295
Prometheus
Cool, we see the same metrics that we were printing out in the previous post. Now
let’s verify that the prometheus server can scrape this data from wavegen:
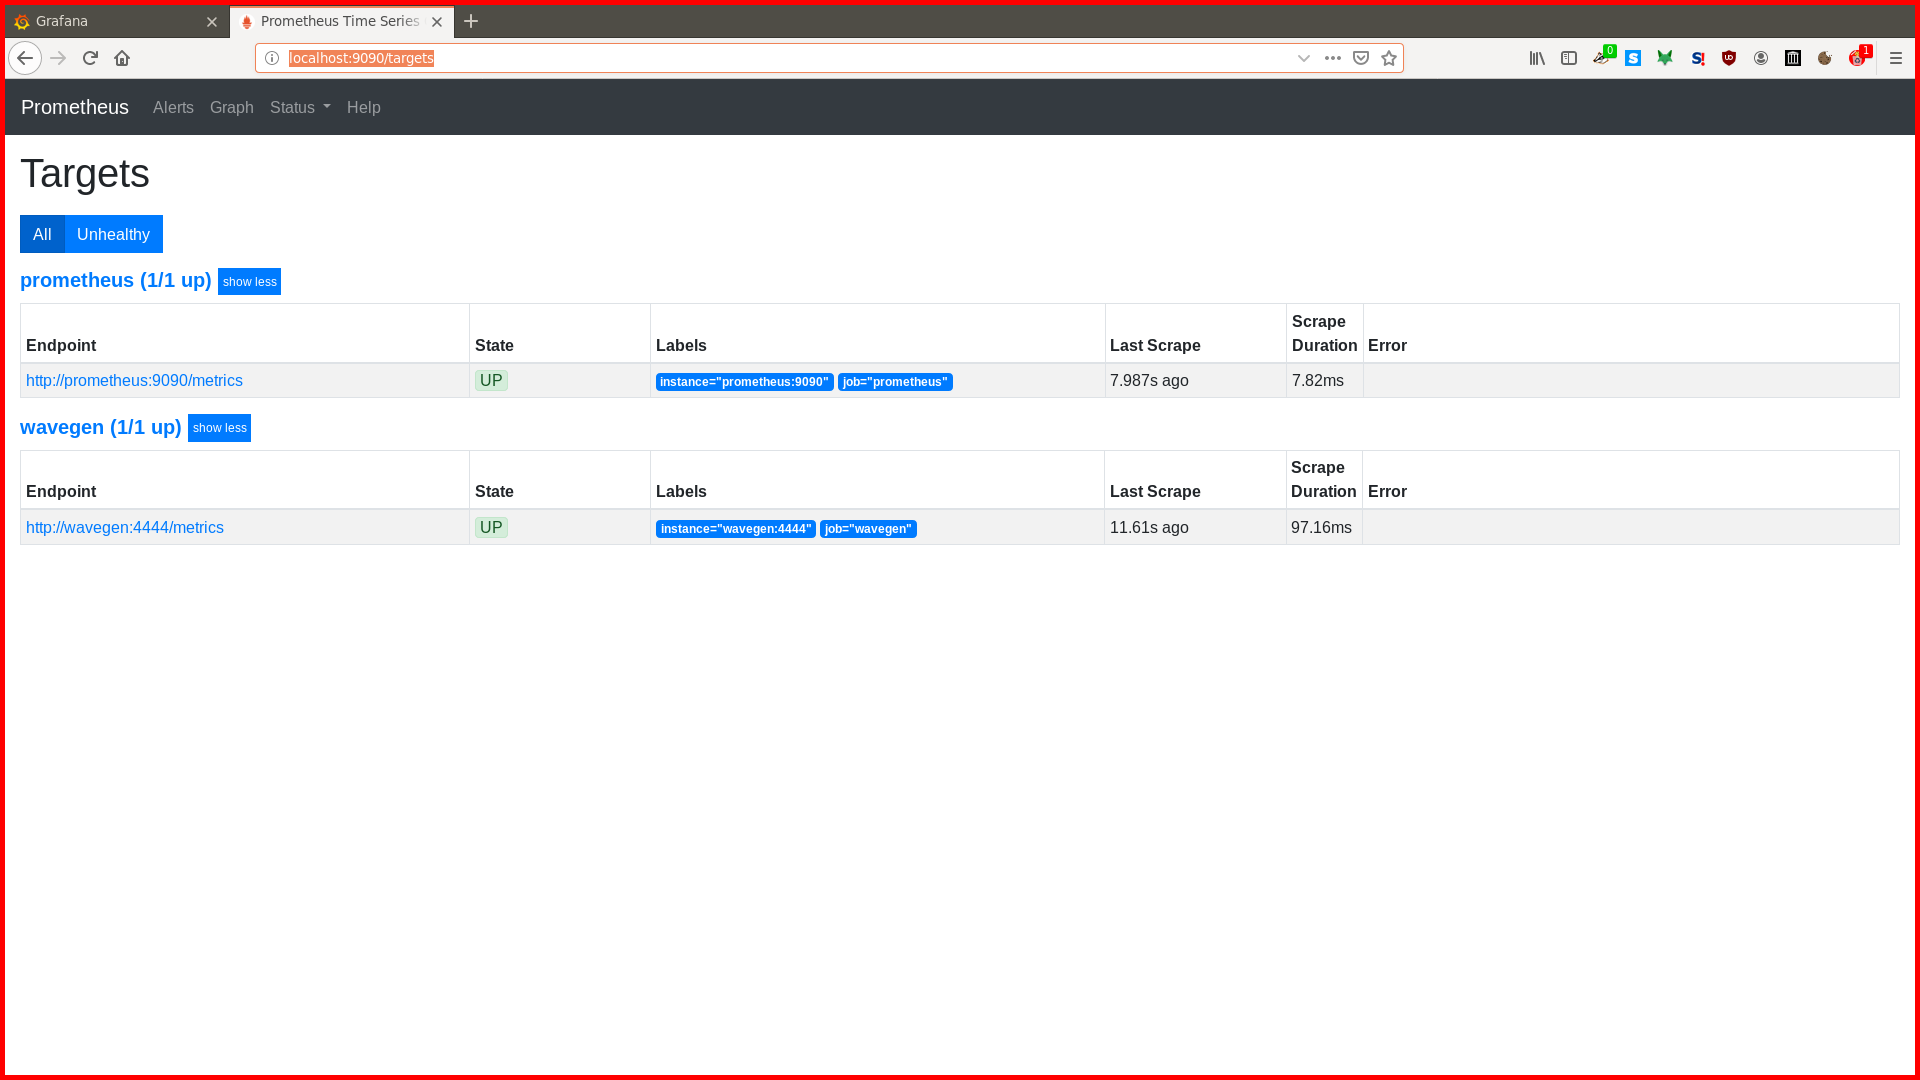
Browse to: http://localhost:9090/targets
You should see both prometheus and wavegen up with a last scrape in the 5-10 second range like here:
Grafana
Browse to: http://localhost:3000/login
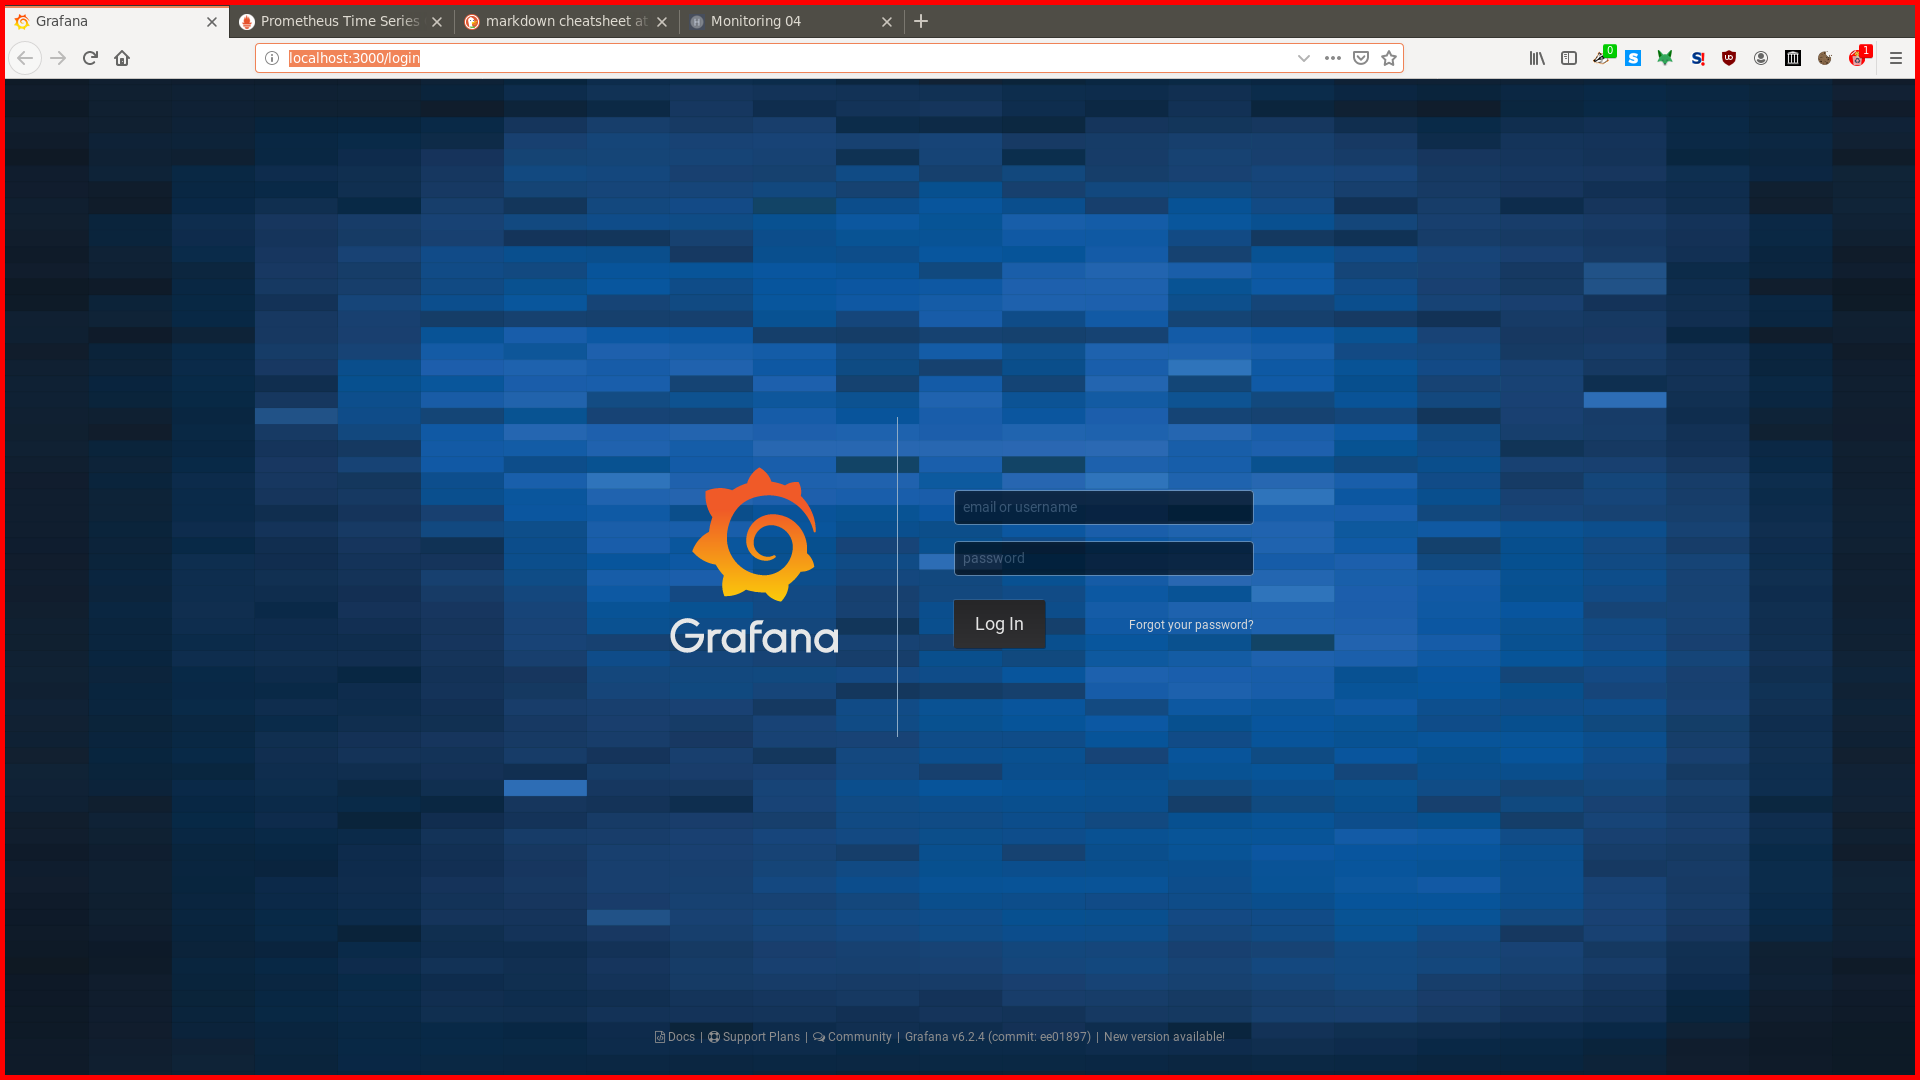
- Enter: admin/admin
- Skip changing the password
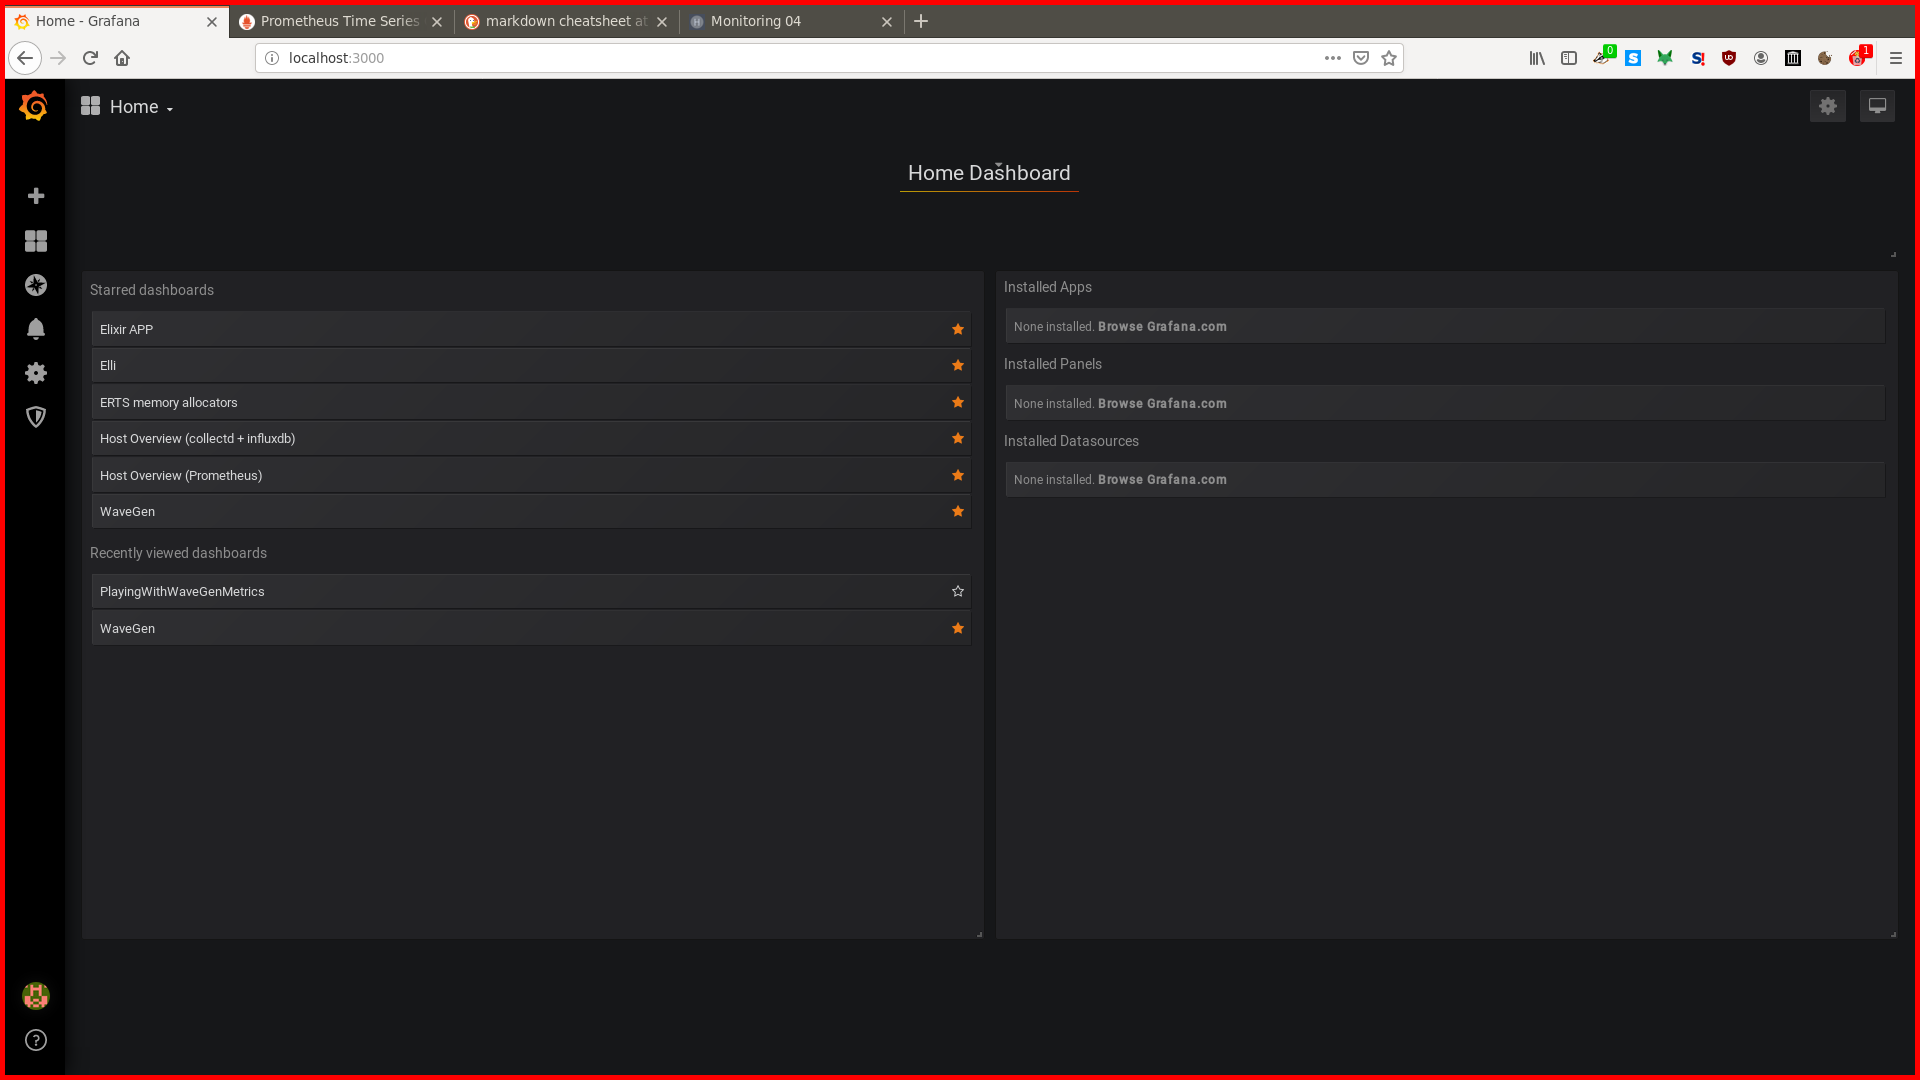
- From here, select HOME
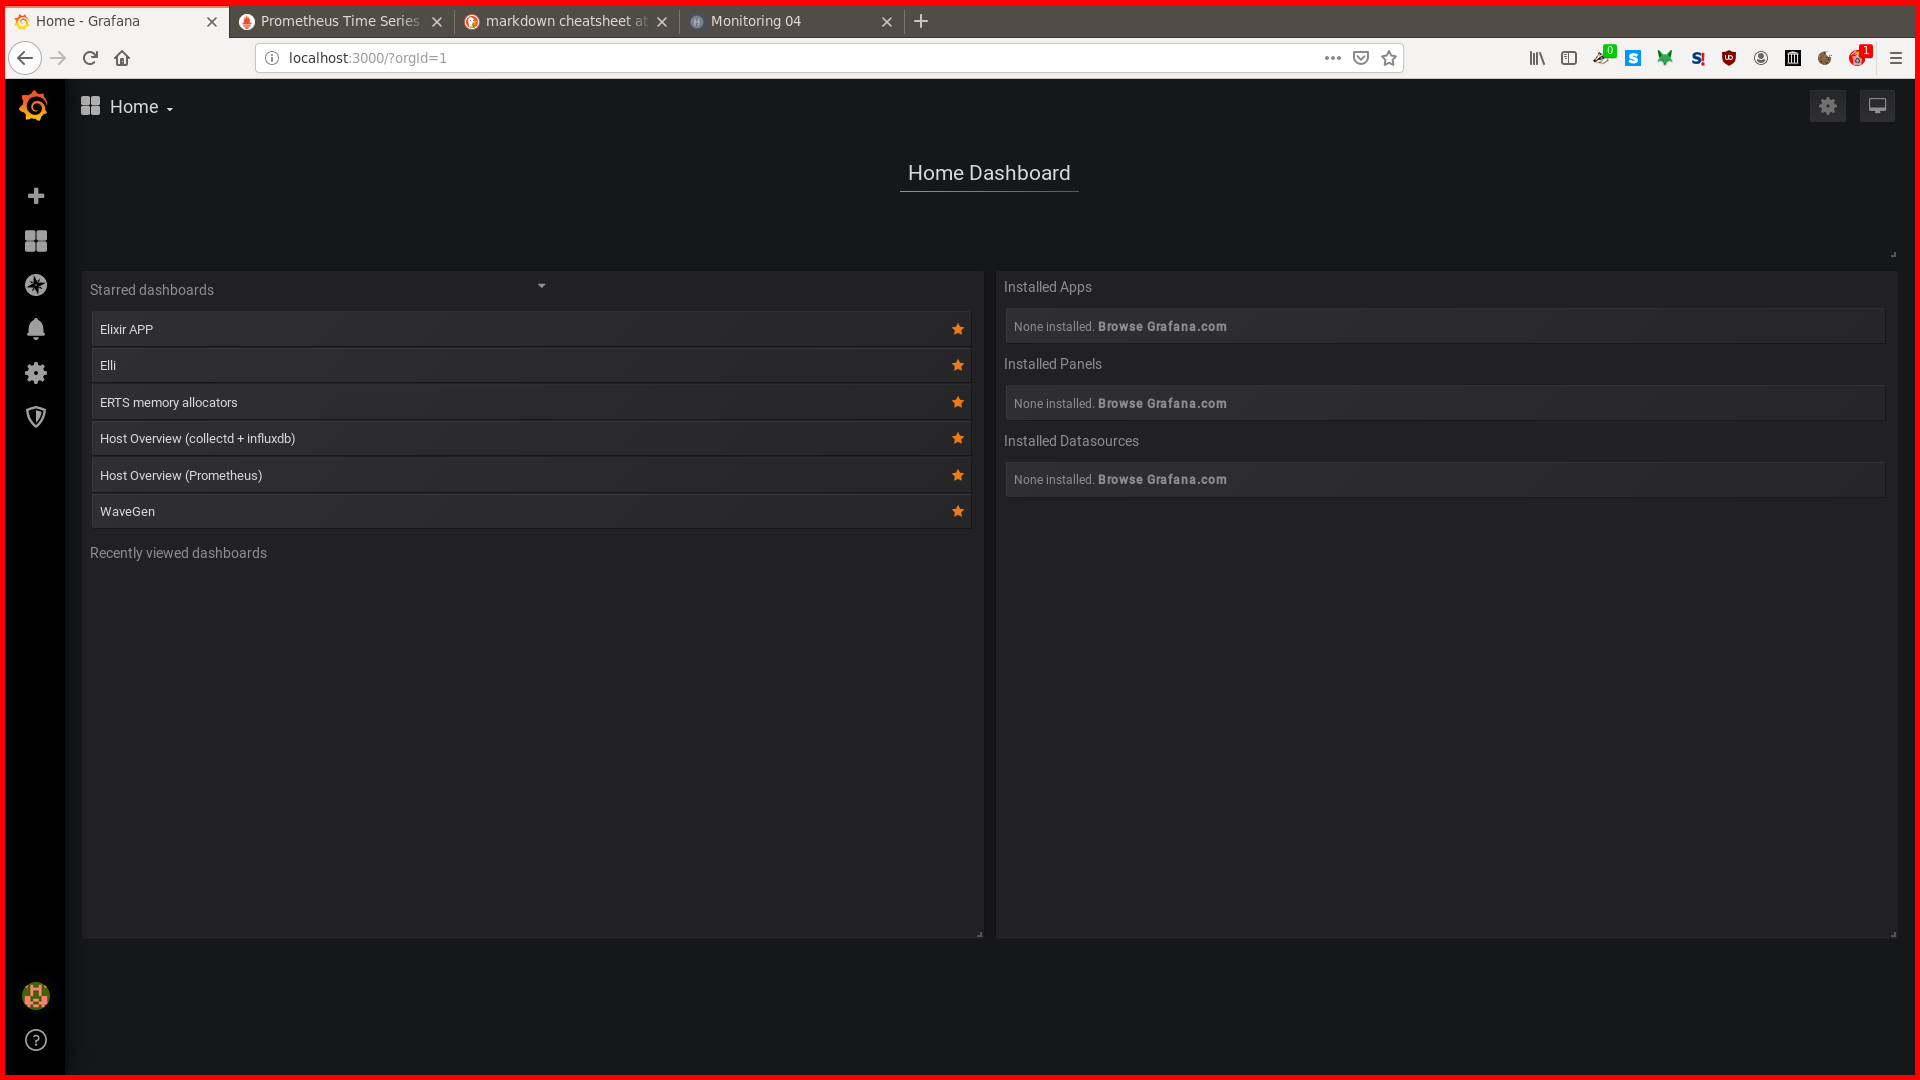
- Select BEAM
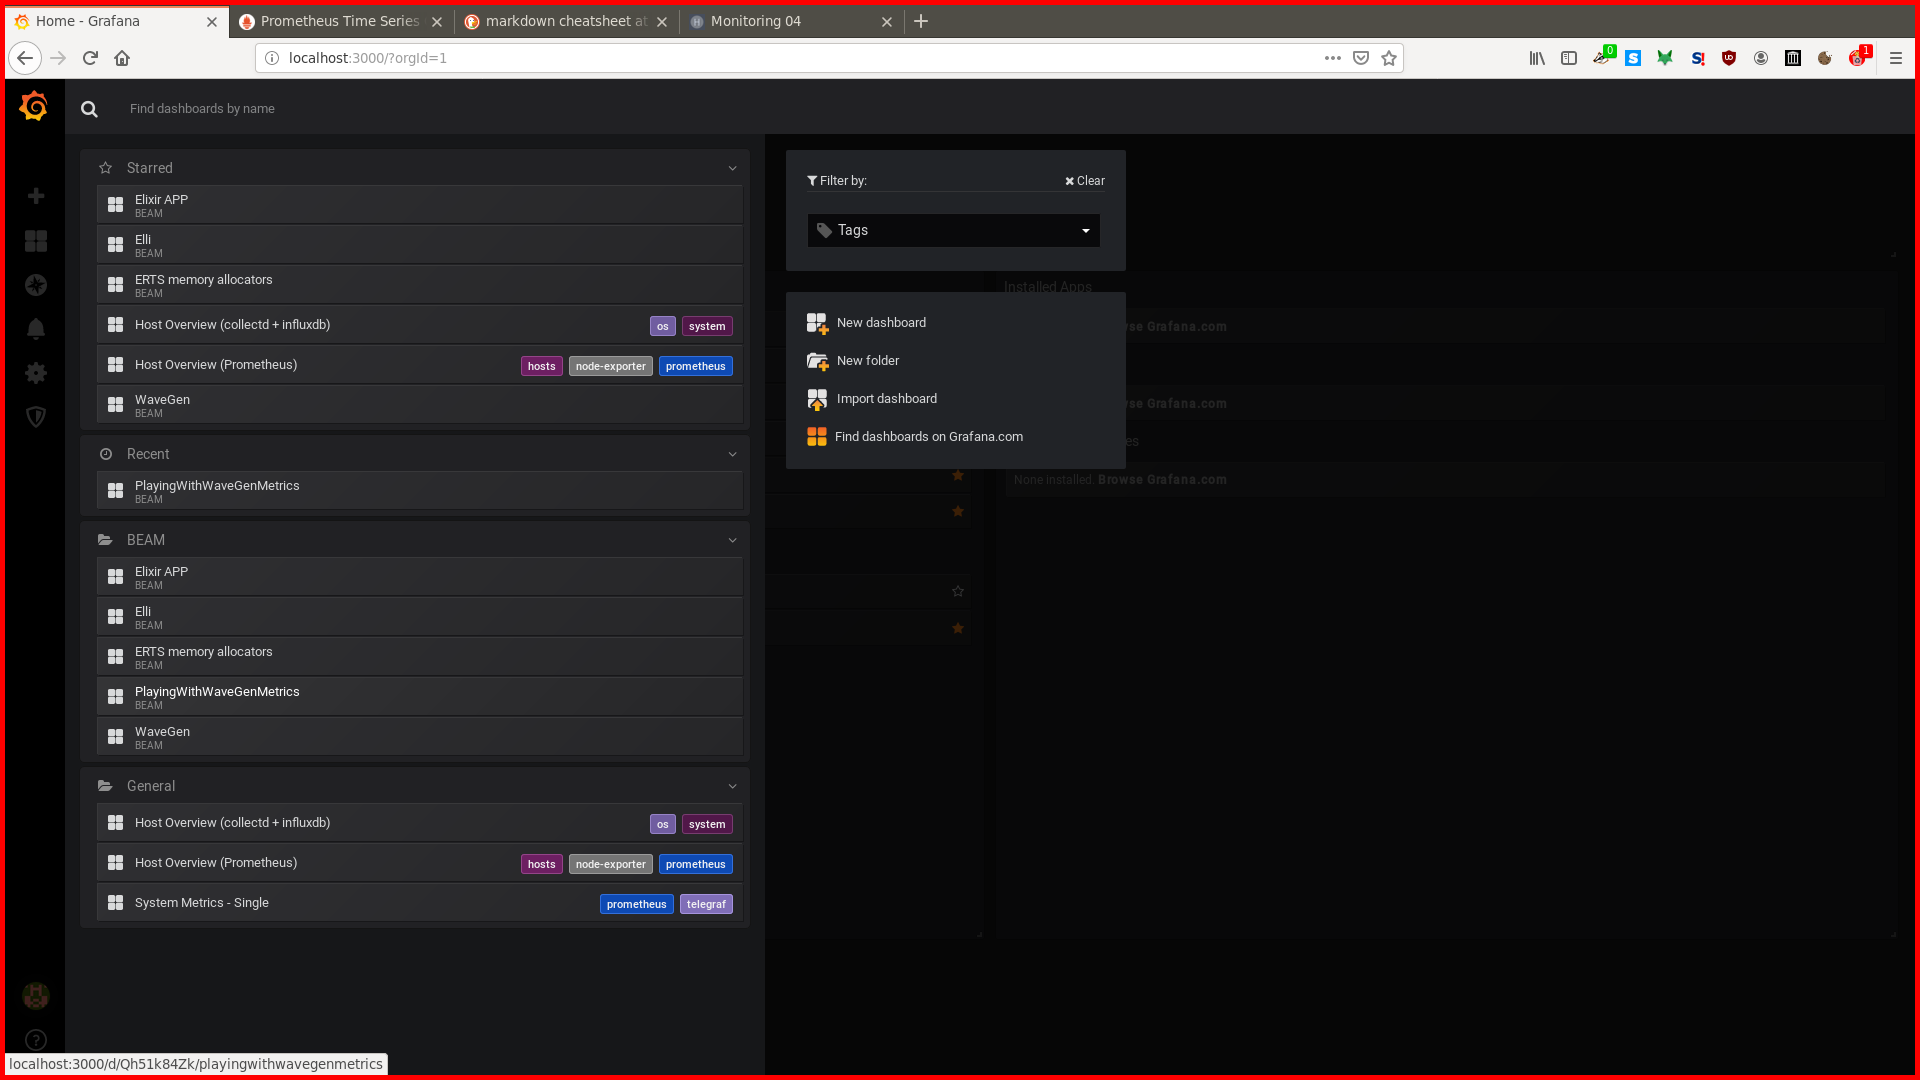
- Select PlayingWithWaveGenMetrics

- We have arrived at the PlayingWithWaveGenMetrics dashboard.
How Prometheus Works
Scrape Interval
The first thing to understand is the scrape_interval. This is the frequency at which
Prometheus will query the targets for their metrics. scrape_interval is configured in
the prometheus.yml like this:
prometheus.yml
global:
    scrape_interval: XXs     # X seconds
Remember that metrics emitters do not normally include timestamps in their data. So
when Prometheus queries the wavegen emitter, this is what that looks like:
mycounter{method="countup"} 25522
mycounter{method="flatline"} 25522
mycounter{method="flipflop"} 25522
mycounter{method="incrementer"} 25522
mycounter{method="sinewave"} 25522
myguage{method="flipflop"} -1
...
Note that there are no timestamps in this data. This means that Prometheus must be
timestamping this data at scrape time. Why is this important you ask? Well, because
if you are looking at something like changes() below:
https://prometheus.io/docs/prometheus/latest/querying/functions/#changes
changes()

For each input time series, changes(v range-vector) returns the number of times
its value has changed within the provided time range as an instant vector.
So the question is, does this mean every time a counter is incremented we get some changes()
value incremented? No, for several reasons. First, the counters like mycounter above are
always increasing. But this counter could increase from say, 1 to 100 in one step, or in 99 steps.
We have no way of knowing b/c the emitter is not keeping track of mutations, it’s keeping track
of a current value. So when the Prometheus scraper queries wavegen:4444/metrics and grabs the
metrics, it’s grabbing a set of current values, timestamping them, and stuffing them into a
time series database.
Let’s get back to a real world example. If we have a counter that is monotonically increasing by
1 every second, what will changes() show? It completely depends on the scrape_interval:
We’ll use the following promql:
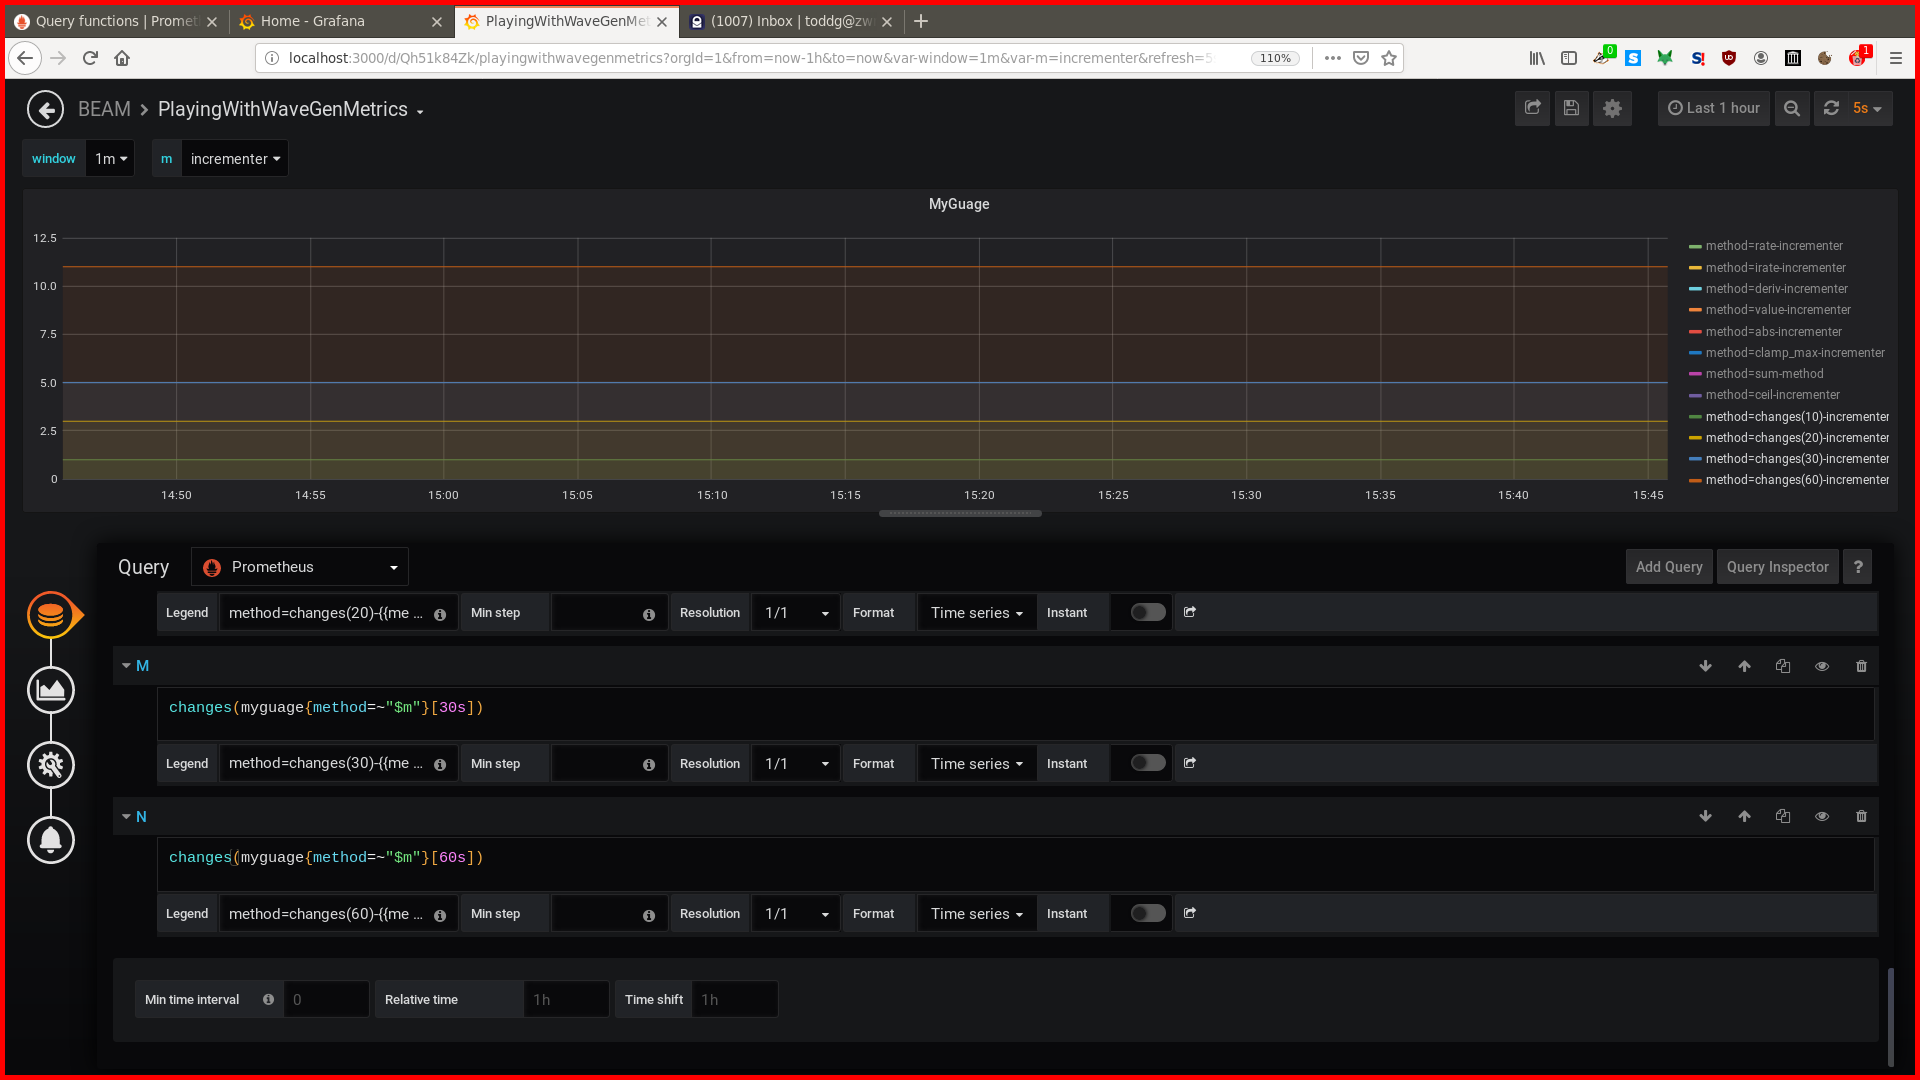
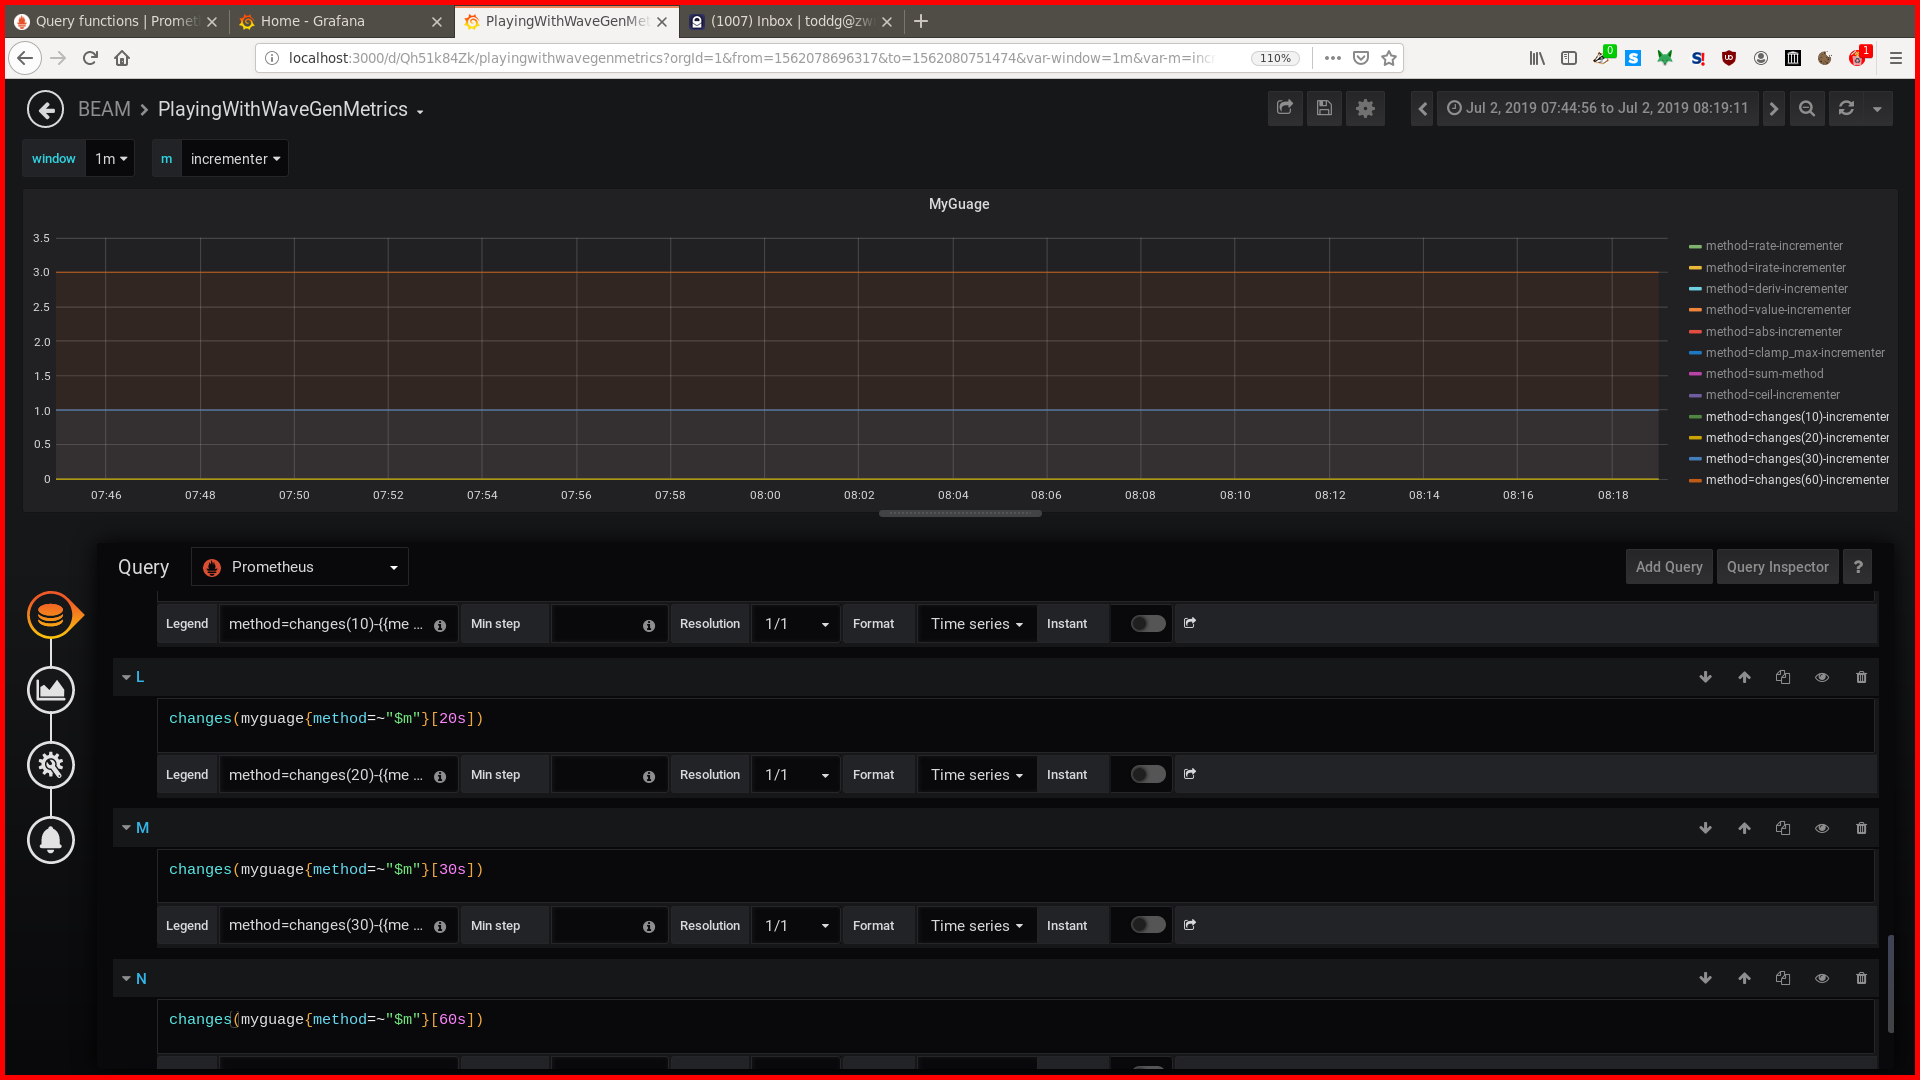
changes(myguage{method=~"incrementer"}[XXs])
Summary
The point of this entire post
Here we have a graph of the incrementer() function where the scraper_interval was set to 05s:
Here we have a graph of the incrementer() function where the scraper_interval was set to 15s:
                            changes
scrape_interval         10s               20s          30s             60s
--------------------|--------------|-------------|--------------|-------------|
15s                     0               0               1               3
05s                     1               3               5              11
The results show that it doesn’t matter how many times a value changes in between scrapes,
what changes() is counting is the number of scrapes that have changed values. This means
that if you have 1 scrape and the value changed, then changes() will show 1. If there are
100 scrapes and the value has changed 50 times, then changes() will show 50. This is such a
simple concept…but the docs made this clear as mud for me and it took a morning of experimentation
to determine how this worked.
The next post discusses Erlang and how to actually wire metrics infrastucture into Erlang applications: Erlang : Where is the Golden Path.